TouchGraph GoogleBrowser
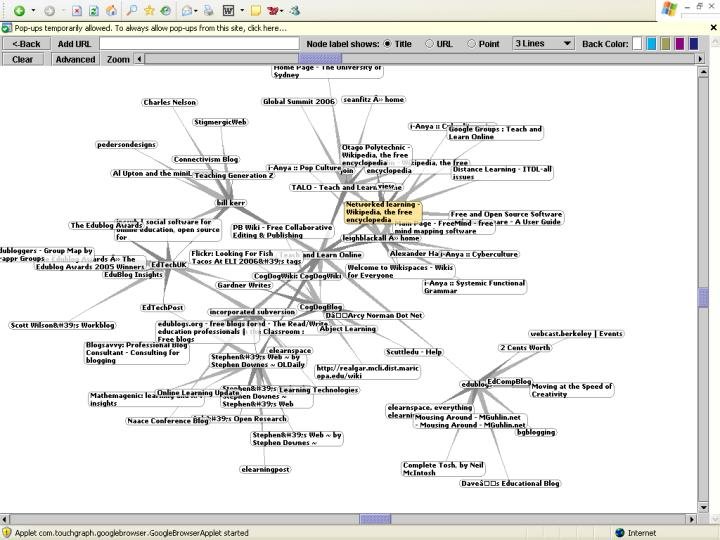
Check out this "picture" of networked learning, using an interesting tool called TouchGraph. This technology may well have been superceded, but it's still interesting seeing the network of networked learning.
The TouchGraph GoogleBrowser shows you what the web "looks like" to the search engine, visually displaying the linkages between your favorite web sites. Computer scientists describe the web as a scale-free network that can be drawn as a graph, with pages represented as nodes (dots), and the links between them represented as edges (lines). Google takes advantage of the web's graph-like structure to help it calculate search results, partly based on the number and importance of links pointing to a particular page. The graph structure can also reveal other interesting relationships -- for example, sites that are related to one another.
The TouchGraph GoogleBrowser uses Google's database to determine and display the linkages between a URL that you enter and other pages on the web. Results are displayed as a graph, showing both inbound and outbound relationships between URLs. Each "node" is labeled, and if you mouse over the node a small "info" box appears -- clicking on this opens up a pop-up window with information about the page. Double clicking on the node sends a request to Google to return ten more URLs that have strong linkages to that particular node.
It's a fascinating way to see not only who links to whom, but also to uncover "hidden" linkages between sites that on the surface appear to have no connection. It's sort of like playing "six degrees of separation" with a search engine. To do this, enter a starting URL, then enter an additional URL to uncover other web pages that contain links to the first set of related URLs. Continue doing this and you'll often be quite surprised to see how closely connected many pages on the web can be. The GoogleBrowser offers several sophisticated controls for refining your views. Unless you're fairly strongly grounded in graph theory, it's best to simply play with the defaults. Full instructions for understanding the graph and using the advanced browsing capabilities are available via the link below. Several other sites use the TouchGraph technology for different types of information. The Amazon Browser is particularly interesting, visualizing the "also-bought" relationships of Amazon shoppers. The PubMed Browser gives you visual relationships for medical literature in the Medline database. And the Google Set Vista is really cool, showing relationships between terms that Google uses to create conceptually related "sets" of words.
posted by Tobes at 9:03 pm
![]()
![]()

0 Comments:
Post a Comment
<< Home